This is the second in a series of articles that describe how scholars at Washington University in St. Louis are bringing their varied skills to bear on the issue of climate change and global warming.

One of the last big unknowns in the global climate equation is Antarctica. How stable is the Antarctic ice sheet? More than a mile thick, on average, it locks up 70 percent of the Earth’s fresh water.
If it melted entirely, global sea levels would rise nearly 200 feet. So understanding how the ice sheet is affected by global climate change is extremely important.
But it is also very difficult both because the ice’s response to warming is inherently complex and because there is little data to go on. Temperature records exist for only a few locations along the perimeter of the continent, and even those go back only 50 or 60 years.
To reach further back in time and provide a long-term record that can inform global climate models, scientists are turning to other means of measuring ice mass.
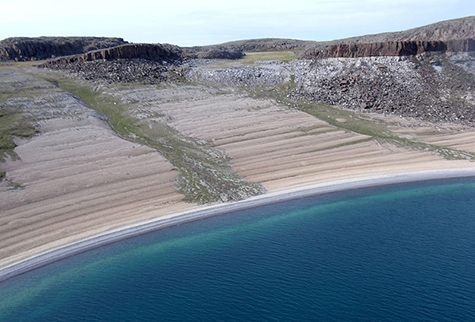
One of these is post-glacial rebound. At the end of the last glacial maximum, when ice sheets reached their maximum extent 20,000 to 25,000 years ago, the ice covering Antarctica was even thicker than it is today. As the cold eased and some of the ice melted, the land mass began to rebound, flexing slowly upward.
The rebound can be used to weigh the ice sheet and determine how much mass it has lost and is currently losing, said Doug Wiens, PhD, professor of earth and planetary sciences in Arts & Sciences at Washington University in St. Louis.
He is an investigator on two new National Science Foundation grants that will fund the installation of seismographs to calibrate crucial parts of the Antarctic ice-weighing machine: the West Antarctic Ice Sheet and the Ross Ice Shelf.
Calibrating the ice-mass scale

How can seismographs, which record the ground motion from distant earthquakes, help with the problem of measuring ice mass and ice loss?
During the last glacial maximum, Wiens explained, the weight of the ice bent the Earth’s crust, forcing the plastic rock in the upper layer of the Earth’s mantle to flow away from the loaded region.
Once the ice melted, the crust began to slowly rebound and the mantle material to flow back under the now-iceless area. Because the mantle material is viscous, it can take thousands of years for this process to complete itself and for the crust to reach equilibrium.
Understanding rebound is important not only for measuring past ice-mass changes but also for accurately estimating present-day melting.
The rate of rebound, however, depends on the viscosity of the mantle material, which in turn depends on temperature. It’s like the difference between honey stored in the refrigerator and in the cupboard. The cold honey is more viscous and flows more slowly than warm honey.
Listening in on West Antarctica

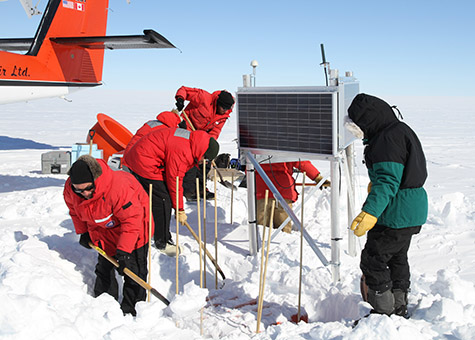
Scientists began an effort six years ago to place instruments in the Antarctic interior to learn more about its ice load. Called the Polar Earth Observing Network (POLENET), the array consists of GPS and seismic stations at remote sites across Antarctica.
The GPS units, which are of geodetic quality, can measure the rate at which the bedrock rebounds with submillimeter accuracy. The seismographs in turn will determine the nature of the material that lies below the ice, allowing the GPS measurements to be accurately interpreted.
One of the NSF grants Wiens recently was awarded is a
continuation of POLENET that will fund the addition of 13 West Antarctic
seismic stations to the 32 already in the POLENET Antarctic network.
The POLENET project is led by Ohio State University, which is responsible for the GPS measurements. WUSTL, the second-largest contributor, is taking a leading role in the seismological studies.
The stations are installed and maintained by WUSTL’s Patrick Shore, PhD, a computer specialist and lecturer in earth and planetary sciences; IRIS-PASSCAL, a consortium of research universities interested in seismology; together with Wiens and several graduate students.
Why West Antarctica? Antarctica is split in two dissimilar parts by the Transantarctic Mountains. West Antarctica, much of which lies below sea level, is the more vulnerable of the two. It is warming rapidly, maybe even faster than most places on Earth.
“We see a lot of melting,” Wiens said, “although it is localized to certain areas.” East Antarctica, in contrast, is an elevated plateau, which seems to be gaining rather than losing ice mass, Wiens said.
“We know the mantle beneath West Antarctica is different from that under Canada or Sweden,” he said. “The ice sheets in the north melted completely about 8,000 years ago and it will take 20,000 years for the crust to rebound. So we know that the mantle there responds over a long period of time.
“In some places in West Antarctica, such as Marie Byrd land, there are volcanoes and high heat flow from below, so it looks to be very different geologically, and that would mean it would respond over a shorter period of time.”
To find out how fast West Antarctica is rebounding, Wiens and his fellow scientists are making CT scans of the earth beneath it, using distant earthquakes instead of an X-ray source and seismographs instead of X-ray detectors. The scans create images of seismic-wave velocity, which is largely controlled by temperature.
“We’re building a picture of the temperature structure that will constrain numerical models of how Antarctica responds to changes in ice mass,” Wiens said. This in turn will provide a means to answer critical questions about the ice sheet’s behavior in a warming world.
Wiens is careful not to get out in front of the data, but he does say that over a long period of time, there is a danger the West Antarctic ice sheet will melt.
“We know it can happen, because it has happened in the geologic past at temperatures not much different from where we are now and certainly where we are headed,” he said.
Listening in on the Ross Ice Shelf

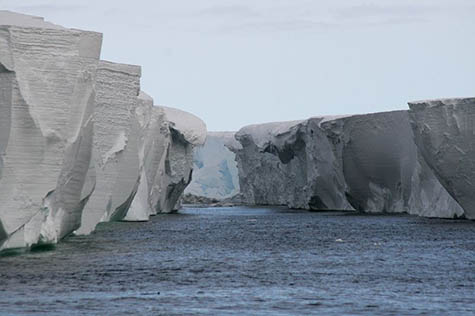
In addition to West Antarctica, Antarctica’s ice shelves are a focus of scientific concern. The shelves are thick platforms of ice that ride on top of the water off some parts of the coastline.
There are many ice shelves but the biggest (about the size of France) is the Ross Ice Shelf, tucked into a deep embayment in West Antarctica. “This is the ice shelf that Scott, Amundsen and Shackleton crossed at the start of their journeys to the Pole,” Wiens said.
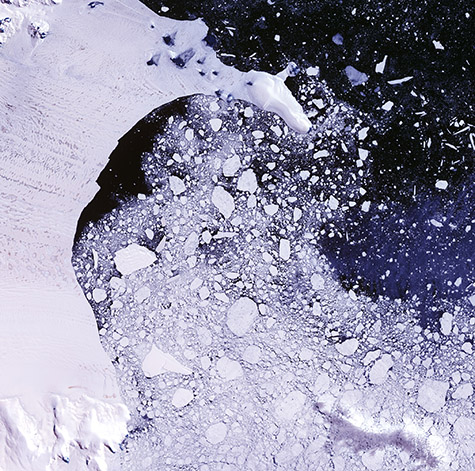
People have been a bit jumpy about ice shelves ever since the Larsen Ice Shelf began to break up. The shelf has three parts, called Larsen A, B, and C, in separate embayments along the east coast of the Antarctic Peninsula. Larsen A disintegrated in January 1995. Larsen B broke up in February 2002. So far Larsen C is holding on.
The second NSF grant Wiens recently was awarded funds the deployment of 18 seismographs on the Ross Ice Shelf. WUSTL, the lead institution, is teaming with Pennsylvania State University and Colorado State University on this grant.
The grant has two goals, Wiens said. The first is to constrain structure of the earth beneath the shelf, because there are some indications that Mount Erebus, a volcano north of the shelf, is fed by a mantle plume, or hot spot.
“Stations have been deployed on the land side of Erebus,” Wiens said, “and now we’re deploying them across the shelf on the ocean side.”
The second goal, however, is to learn more about the ice shelf itself, including its response to long-period ocean waves that lift and drop it. How the shelf responds to wave forcing will tell us how strong the ice is, Wiens said.
Long-period waves are thought to have triggered the early stages of the disintegration of the Wilkins Ice Sheet, an ice sheet on the southwest side of the Antarctic Peninsula, in 2008.
The seismographs also will pick up microearthquakes caused by the opening of crevasses. This is important because added pressure from surface water filling crevasses can drive cracks right through the ice sheet.
Again Wiens is careful not to create misconceptions. “I don’t think anyone thinks the Ross Ice Shelf is going to break up right away,” he said. “But other smaller ice shelves have broken up and they seem to break up suddenly, so I think there’s a long-term issue.”
In the meantime, he is just happy to be getting better data. “To see these questions slowly being answered is very exciting to me,” he said. “When we started POLENET six years ago, we had no idea what we would find.
“Now we’re beginning to fill in the details — and we’ve made some unexpected discoveries.” One of which is a new volcano discovered under the ice by Amanda Lough, a WUSTL doctoral student he advises.
NSF-funded research in this story: Douglas Wiens, Washington University, Award No. 1246712; Douglas Wiens, Washington University, Award No. 114518