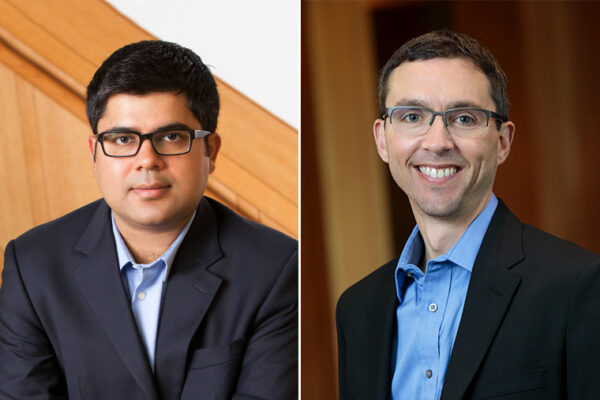
The McKelvey School of Engineering’s Rajan Chakrabarty and Randall Martin are a world apart when it comes to research.
Both study the Earth’s atmospheric components, particularly — though not exclusively — aerosols, in the Department of Energy, Environmental & Chemical Engineering. These are tiny bits of solid matter suspended in air. They can absorb and reflect light, contributing to the warming and cooling of the atmosphere. And when they are below a certain size, smaller than 2.5 microns, these particles can enter a person’s bloodstream and penetrate the lungs.
PM2.5, as it’s called, is the leading global environmental risk factor for mortality.
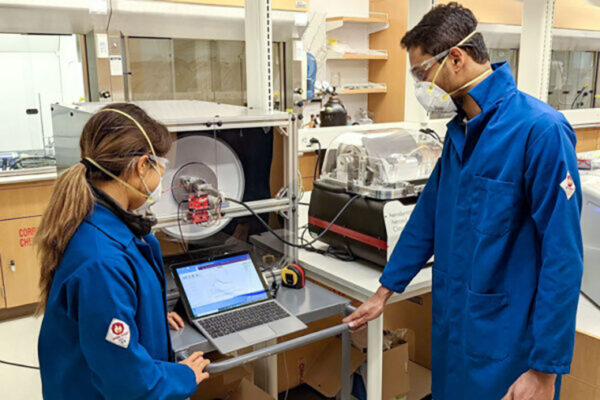
Though the focus of their research is similar, Chakrabarty, the Harold D. Jolley Career Development Associate Professor, conducts his research with both feet firmly planted on the ground. He chases wildfires, takes measurements from household cookstoves in developing countries, and watches the chaotic motion of a few aerosols — or even just one — using high-tech instruments in his lab.
By contrast, for his research, Martin, the Raymond R. Tucker Distinguished Professor, depends on data collected from above the clouds, on the edge of space. Using NASA satellite data, as well as data from a network of air-quality monitoring stations that span the globe, he uses computer modeling to better understand the composition and movement of aerosols around the planet.
But this is not a story of never the twain shall meet. On the contrary, the two research methods are intertwined, depending on each other in more ways than one. And their data meet to inform some of the most consequential aspects of our lives: They meet in the lung, where PM2.5 makes us more susceptible to infections such as COVID-19. They meet in the increasingly ferocious wildfires of Utah, California and New South Wales, which send brown carbon spewing across the globe. And they meet in an atmosphere altered by aerosols that absorb and radiate heat — destabilizing the climate, making extreme and deadly weather events more common while threatening our homes, our livelihoods and our health.
They meet, as Martin says, “because in the end, they’re the same aerosols.”
From the ground up
If you’ve met Randall Martin, chances are that you know about the relationship between aerosols and health.
“I know I often say it, but it’s so important: Aerosols are the leading environmental risk factor for mortality worldwide.” Some of his most recent research makes this unmistakably clear.
This past summer, Martin and an interdisciplinary team of researchers published results of a study revealing that more than 1 million deaths worldwide in 2017 were attributable to the burning of fossil fuels, which forms aerosols through multiple pathways.
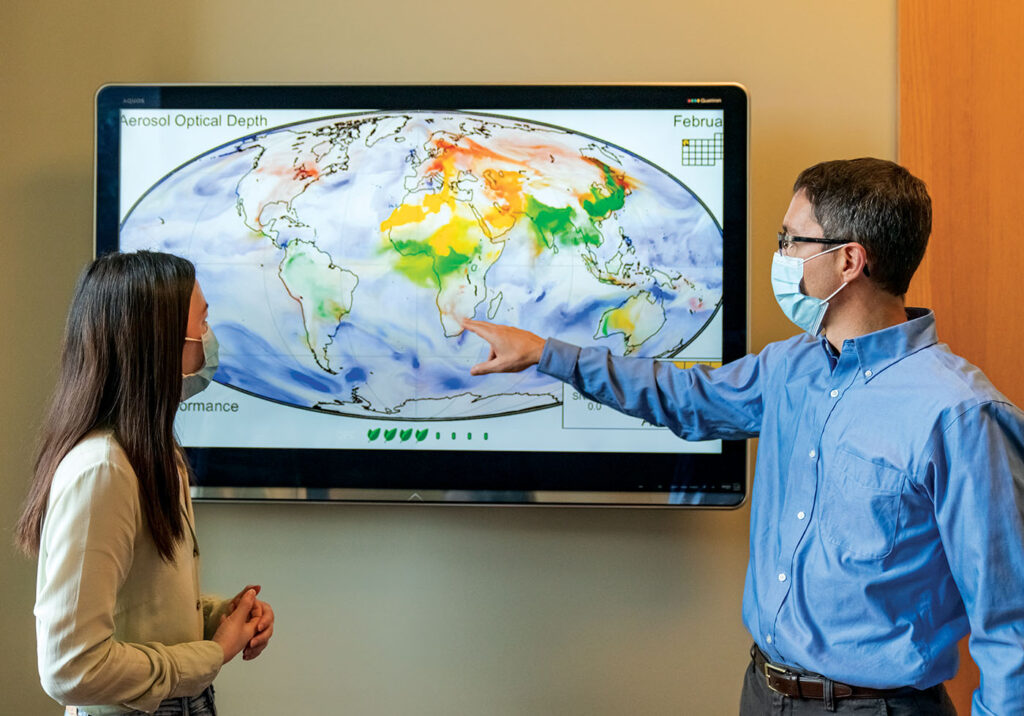
To do such a study requires a vast amount of data: health data from the Global Burden of Disease; NASA satellite images of vertical columns of the atmosphere (known as aerosol optical depths) that stretch from the ground to space; measurements from ground-based air- monitoring stations; details about what sources were responsible for emissions in different locations; data about the relationships between aerosols and various health outcomes.
While impressive in their depth and breadth, the data are static. Plugging the data into models, however, sets them in motion. The GEOS-Chem
model, which he helped develop, allows Martin to use the satellite data to determine the concentration of PM2.5 aerosols on the ground and to simulate how they move across the globe. That’s how he was able to show the relationships between health outcomes and aerosols: models.
But how do the models know what to do with all that data? How do the laws of physics act on aerosols?
That information comes from the ground up.
Researchers such as Chakrabarty investigate aerosols on the ground and in the laboratory, measuring their intrinsic properties as well as the ways they physically interact with their environment, all in a focused effort to understand their fundamental nature.
Ultimately, “You can model the entire universe using simple, underlying physics-like laws.”
— Rajan Chakrabarty
Those laws, the rules that govern how aerosols move through and interact with the atmosphere, are an essential spark that brings to life the models used by researchers. Once they feed those laws into complex atmospheric models, the data gathered from satellites and ground-based air- monitoring stations begin to move, mimicking the motion seen on the ground.
Chakrabarty and researchers like him provide another service to researchers developing and improving models: ground truth. When a model suggests that, for instance, weather patterns will carry soot from California wildfires to Missouri, how do they know the model is right? A researcher on the ground takes a sample of the air; if there’s long-range transported soot in Missouri, the model has been validated. If there isn’t, the model is tweaked, and they try again.
The model is then calibrated, in a sense, to an area where the on-the-ground truth is already known. This helps the model more closely mimic the natural principles at work.
“We not only provide information about what’s happening on the ground,” Chakrabarty says. “We also provide ground truth.”
Modeling chaos
Chakrabarty came to Washington University in 2014 after beginning his academic career at the Desert Research Institute in Reno, Nevada. He has a master’s degree in atmospheric physics and a PhD in chemical physics, both from the University of Nevada, Reno.
With all that physics in his background, it’s no surprise that Chakrabarty’s contributions to the field have clustered around uncovering the underlying rules that govern aerosol transport, as well as discovering new knowledge about the ways they absorb and radiate heat.
But he probably does spend more time chasing wildfires than most physicists.
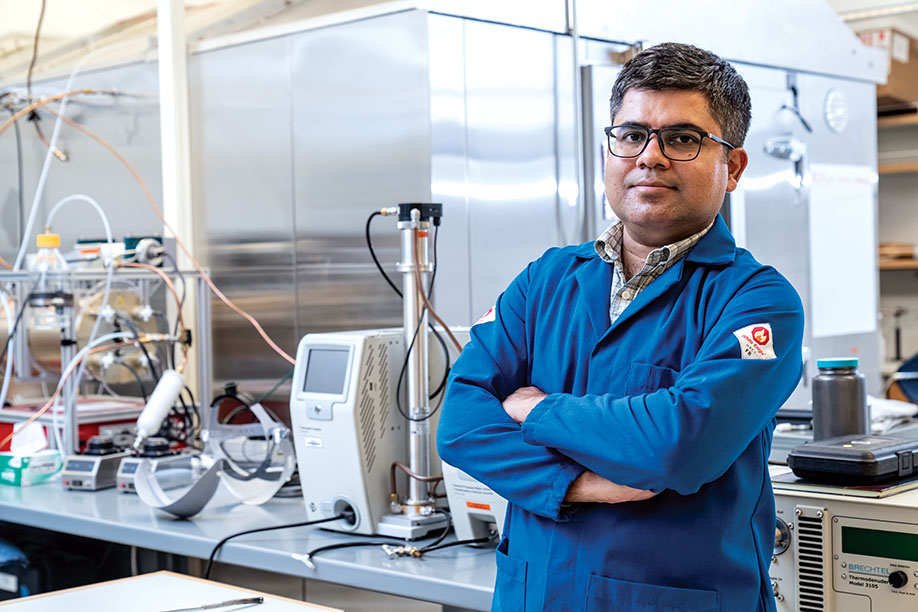
“We wanted to get a handle on what’s happening in these real-world fires in the western United States,” he says. How do all the aerosols and gas emissions — that together most people just call “smoke” — interact with the atmosphere?
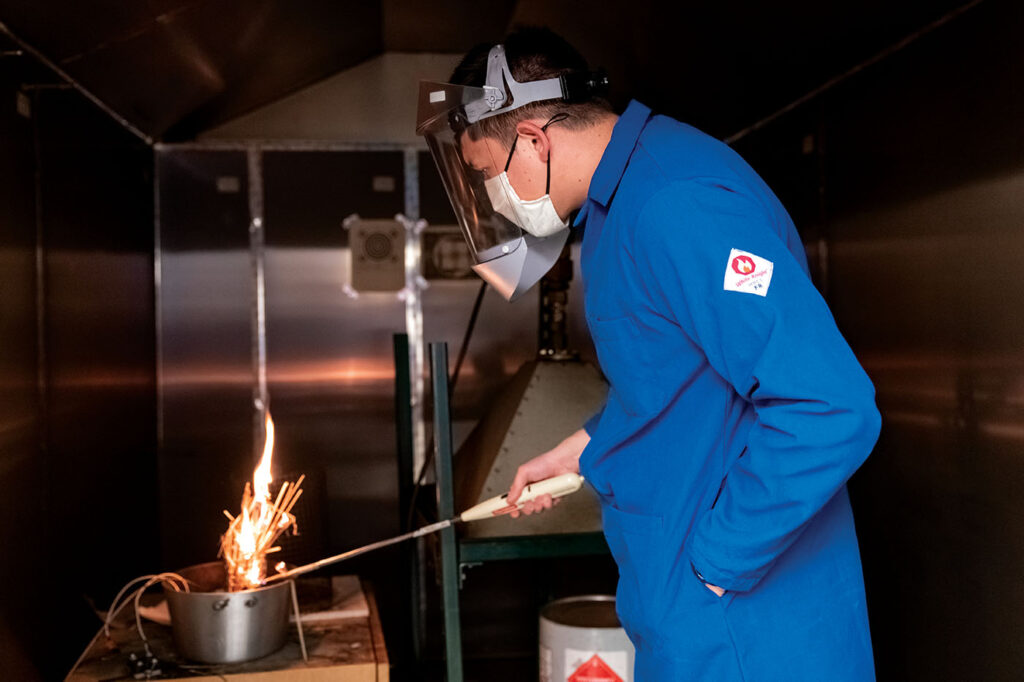
In the summer of 2019, Chakrabarty and his team loaded a suite of specialty instruments that they’d built in-house into a van and headed west as part of the NASA/NOAA interagency FIREX-AQ project. “We studied smoke over periods of 24 to 36 hours. Nobody slept,” he says. And as a result, they were able to gather data showing that a conventional viewpoint held by researchers about a particular class of aerosol — organic carbon — needed revision.
Organic carbon is thought to reflect sunlight because of its white color, somewhat offsetting the warming effect of soot. But watching its chemical evolution on the ground, Chakrabarty and his team found that at night, organic carbon gets a boost in its ability to absorb sunlight. “It’s a balancing act,” he says. “In the daytime, the photochemistry diminishes the light absorbing and warming effect. In the nighttime, it increases the effect.”
Which one wins out?
“We think the nighttime wins out,” he says. Like soot, these organics go on growing their strength in absorption as the plume of smoke ages. The research was recently published in the journal Atmospheric Chemistry and Physics.
Chakrabarty also still works in a lab. Yes, it’s a lab in which he can re-create wildfires, but it’s a bit safer and a place where he can really get down to fundamentals.
There, he uses aerosols to understand chaos.
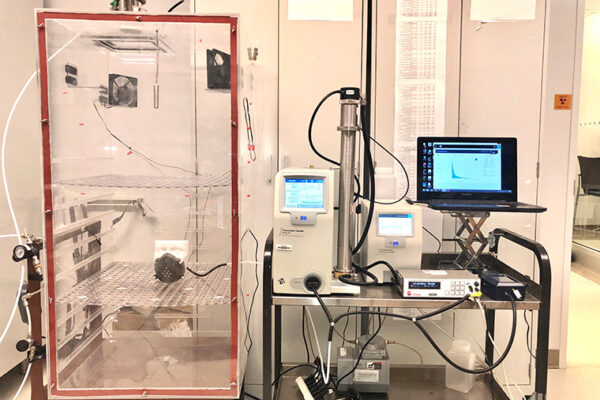
In his lab, Chakrabarty’s team set up a box containing soot particles. Then they created a turbulent “atmosphere,” an example of a chaotic system. Using a high-speed camera, they plotted the path of the soot as it zipped around in a seemingly unpredictable way.
Then they turned to a kind of machine learning called a “generative adversarial network.” In a sense, it’s like two computer programs. One tries to trick the other into believing that fake data actually fit the pattern of real data. The more it tries to create plausible fake data, the closer it gets to actually fitting the pattern.
In doing so, it moves closer in reality to describing the chaotic motion of soot in a plume.
Ultimately, this model can help predict chaotic behaviors of anything, from the motion of a single aerosol in a turbulent system to the hidden pattern of seemingly random tics in children.
“By observing chaos in nature,” Chakrabarty says, “what seems to be completely chaotic is actually telling us something.”
From skeptic to believer
In the 1990s, Martin came to the field precisely because he was concerned about what he was hearing about climate change. He was working as an engineer and increasingly reading news stories about climate.
“I couldn’t make sense of them. They would present two opposing views: Yes, it’s happening. No, it’s not.” Martin really wanted to get to the bottom of this, so he changed careers, earning master’s degrees from Oxford University and Harvard University in environmental science and engineering sciences, respectively, and a doctorate from Harvard University in engineering sciences.
“Climate is what brought me in, first,” he says.
He came for the climate science but stayed for the modeling. When he began his doctoral work, Martin says he wanted to work with data and measurements because, at the time, he didn’t trust models. But after investigating satellite data, he realized that there definitely was a need to be able to accurately interpret observational data. “In the absence of a model, you just get a pretty picture from a satellite that one can provide anecdotes about.”
From there, Martin went on to contribute to the chemical transport model that is so integral to the work he does today; he is now a co-model scientist for GEOS-Chem. This work gave him a true understanding of the power of modeling. He began looking at trace gases, but once he realized the consequences that aerosols have for human health, his new path was set.
Martin’s skill in combining satellite remote sensing and modeling bears out its applications. His laboratory regularly publishes global pollution estimates — a comprehensive, consistent map of pollution across the globe. Those data from Martin’s lab are used by the World Health Organization and the Global Burden of Disease.
Their most recent long-term pollution estimates, published in 2020, span 1998 to 2018.
Modeling global pollution is necessary because there is no comprehensive air-quality network covering the planet. There are fairly extensive monitoring systems in some areas — North America, Europe and China — but much of the world is a mystery.
Here is how Martin’s lab fills in the gaps: First, there’s the data. NASA satellites and scientists provide the aerosol optical depths, global data about the vertical column of atmosphere stretching from orbit to the ground. His group has developed algorithms to combine data from multiple satellite instruments together with output from the GEOS-Chem model and with sparse ground-based measurements to infer how much PM2.5 is on the ground, at the bottom of any particular column anywhere in the world. And ongoing improvements to their algorithms, which combine these information sources, are paying off. When they tested the 2018 findings against air quality at monitoring stations, Martin’s group found their estimates were closer to the actual measurements than had ever been determined before.
Because, at the time, the data were so new, they were able to capture the results of mitigation strategies put in place that other models hadn’t. In China, for instance, Martin’s group found a significant drop in pollution in the recent past as the result of strategies begun in earnest around 2011. Other data sets hadn’t captured the drop.
Martin’s research is a way to quantitatively understand satellite observations — and to understand the processes contributing to aerosol formation, loss and movement. It does more, however, than offer a static picture of the atmosphere. “It offers a predictive capability of aerosols,” he says, “and allows us to develop alternative scenarios.
“If we wanted to reduce the aerosol burden in a certain region, for either health or climate purposes, we’d want to test any scenario in a model before undertaking any activity.”
That’s the real power of these models: They are dynamic and flexible and can be used to predict outcomes by tweaking the input conditions. Would building a factory in one city change the air quality in another? Add the factory as a source of pollution into the model and see what happens.
Showing consequences of our actions
Like Martin and Chakrabarty, aerosols operate on various scales. “They affect every person individually through health, while climate effects are generally on a larger scale,” Martin says.
At the global scale, researchers with their feet on the ground and other researchers with their eyes on the sky come together to tell the story of one of the most critical times in human history.
In August, Working Group I of the Intergovernmental Panel on Climate Change (IPCC) released its 2021 assessment report. Among other findings, the report concluded that the planet will not be able to stave off a 1.5 C rise in temperature within the next 20 years. That additional heat, modulated by aerosols that absorb and radiate the sun’s rays, will shrink the divide between the individual and global scales:
“Many changes in the climate system become larger in direct relation to increasing global warming. They include increases in the frequency and intensity of hot extremes, marine heat waves, and heavy precipitation, agricultural and ecological droughts in some regions and proportion of intense tropical cyclones, as well as reductions in Arctic sea ice, snow cover and permafrost.”
— from the Intergovernmental Panel on Climate Change 2021 report
In addition to those effects, outlined in the IPCC report, increased pollution may have set us up for the spread of COVID-19.
At the beginning of the pandemic in the United States, Chakrabarty said he was surprised that the infection had taken off so quickly. He wanted to understand if aerosols affect the basic reproduction ratio — R0 — of COVID-19, which denotes the expected number of people each sick person can infect.
Chakrabarty’s lab took a look at places where R0 was greater than one, the point at which an illness takes off, spreading through a community. They factored in more than 40 variables, from age to stay-at-home orders. Then a role-reversal of sorts took place; like the objects they study, aerosol scientists are a dynamic sort.
His team turned to Martin for data, specifically for pollution estimates across the country, to see whether there was any connection between R0 and pollution. Together with collaborators at Saint Louis University, they found there was, but it wasn’t intuitive. The effects were seen mostly below a certain level of pollution. Chakrabarty thinks that is because the initial exposure is a catalyst for change: There are no adverse effects until pollution hits a certain level. Then, all at once, everyone’s exposure crosses over from not susceptible to susceptible.
The effect was present at PM2.5 levels below 6 micrograms per cubic meter. National levels of “safe” exposure to PM2.5 are set at or below 12 micrograms per cubic meter.
“In most of the U.S., we think there’s a certain standard set, and so long as we’re below that standard, or at that standard, we’re OK,” he says. But it may be that problems arise when pollution levels are much lower than the standard, setting us up to become infected with and to spread airborne illnesses like COVID-19 with relative ease.
Joining forces, so to speak, Chakrabarty and Martin were able to pinpoint another example of the merging of the individual and global effects of climate change. The two researchers will continue to probe the nature of aerosols together, 500 miles apart.
Chakrabarty is already working with Martin’s grassroots Surface Particulate Matter Network (SPARTAN). This network of air-quality monitoring stations will measure the concentrations of PM2.5 to help enhance satellite estimates — the ground truth for climate models.
Chakrabarty is using his expertise to analyze the particulate matter collected at the stations, while Martin will return to his models, updating them with the information Chakrabarty and others provide.
Martin is working on a new modeling system, a joint project with Harvard, MIT and NASA. They want to merge the 500-mile-high view with the down-to-earth view, creating a new type of chemical transport system that can use satellite data to retrieve very fine resolution over a region the size of, say, St. Louis, while retaining the large-scale, global transport capabilities.
These tools — chemical transport systems, modeling a single soot particle in a lab, chasing down a wildfire in a van that you may or may not also sleep in — are designed first and foremost to help us understand and explain the world around us. But the best-case scenario is that they can guide us to make better choices. Martin, whose research originates in space, ties his work firmly to the ground, keen to understand the consequences of those choices through modeling.
“We look at this data, put it together, and we can understand how things move around the globe. The models provide more than a descriptor; they show the real consequences of our actions.”
— Randall martin
Though Chakrabarty’s research keeps him busy analyzing data from ground-based monitors, or cooking up research in the Indian countryside, he often takes a more abstract view.
Once you can describe the motion of a particle, “Now you have order in chaos,” he says. The new understanding offers a peek into the framework that governs the world.
“And these laws are what the universe is actually. There are laws governing everything, but they’re hidden. You just have to uncover them. That is what science is doing, right?”
